Working with the Planning Analytics Cube Viewer #
Planning Analytics for Excel is full of tools and functions that help you do your job. One of the most helpful is the Cube Viewer. The Cube Viewer allows you to open a Cube View within Excel rather than using the web front end (Planning Analytics Workspace). You can therefore see the dimensions and data of a particular cube.
If you are or have been a Perspectives user in the past, this may remind you of the Explorer function. The difference is that this Cube Viewer opens the cube in the new Planning Analytics style and has additional tools.
Whether you have experience or not, Cube Viewer has lots of useful features. In this article we’ll walk you through opening and navigating the Cube Viewer.
Opening the Cube Viewer
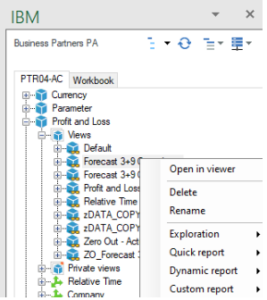
Firstly, you’ll have to be connected to a database within Planning Analytics for Excel, which you can do in the ribbon. You can then open the Cube Viewer by choosing a specific cube or view within the database tree pane, and then select ‘Open in Viewer’.

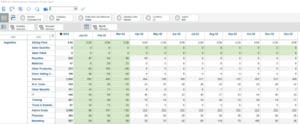
The Cube Viewer window will look like this

Navigating the Cube Viewer
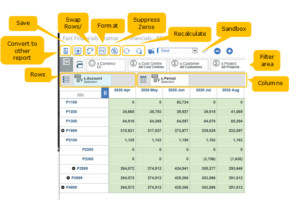
The following diagram shows you the location and name of each button:

Here’s what each button does:
Convert
You can use this button to convert what you are currently working on to different Planning Analytics for Excel reporting types such as:
- Exploration
- Quick report
- Dynamic report and
- Custom report
Save view
This button saves a view into the cube. IBM Planning Analytics stores data inside a cube, so saving a view is useful so that you can recreate that view in another report to get a meaningful slice of the data.
Bear in mind that the save button does not save the data. Data is stored in the database when you type into the cell or hit the recalculate button.
Formatting data
You can use this button to format your data inside cube view.
To the right of format button is the swap rows and column button.
The Suppress Zeros button removes sparse data from view, so you don’t see any cells that contain a null or a zero number.
The recalculate button can be used when data changes. There are two calculate buttons, manual recalculation and automatic recalculation. If you set recalculation to automatic, any data changes will automatically be recalculated (this can have an impact on the view performance, so bear that in mind)
Next is the sandbox button. Using this button, you can create a sandbox. A sandbox is a copy of your database, you can use a sandbox to create multiple scenarios without impacting your base data.
Below the toolbar you will see filter area, which is where you can filter the data in the grid using dimensions. You can also choose specific members within these dimensions to filter data by.
Below is row/column area. You can swap dimensions in the rows and column area to display different views. To change the dimensions in the rows and columns area, click and drag one of the dimension boxes into the row or column drop zone.
You can also drag a dimension on top of another to swap them over or drag a dimension to the side of another (in the row/column drop zone) to show two dimensions next to each other (known as nesting).


