This article gives you a step by step guide on how to create a new hierarchy within a dimension in Planning Analytics using standard product functionality.
In a PAW (Planning Analytics Workspace) workbench, export the members of a dimension. Product in this case.
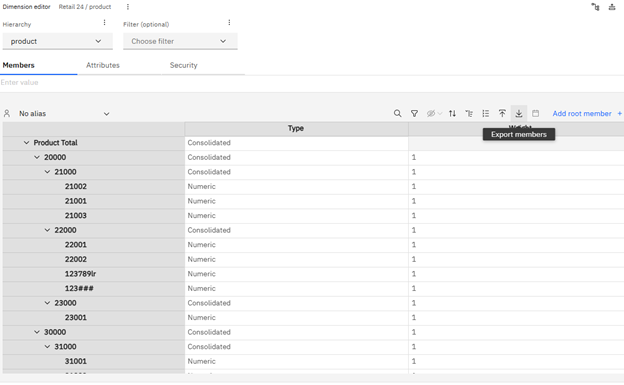
This provides a list of products.
In this example, the objective was to create a hierarchy for the maturity of the products in which they are split into 3 types, ‘New’, ‘Mature’ and ‘Cash Cow’ with a root member of ‘All Cycles’
The next step involved creating a simple hierarchy for the products in a new csv file with 4 headings:
Member, Parent, Type and Weight.
Example CSV format #
| Member | Parent | Type | Weight |
| All Cycles | Consolidated | 0 | |
| New | All Cycles | Consolidated | 1 |
| 32003 | New | Numeric | 1 |
| 21003 | New | Numeric | 1 |
| 33003 | New | Numeric | 1 |
| 31004 | New | Numeric | 1 |
| 42003 | New | Numeric | 1 |
| 123789lr | New | Numeric | 1 |
| 123### | New | Numeric | 1 |
| Mature | All Cycles | Consolidated | 1 |
| 21002 | Mature | Numeric | 1 |
| 22002 | Mature | Numeric | 1 |
| 31002 | Mature | Numeric | 1 |
| 32002 | Mature | Numeric | 1 |
| 41011 | Mature | Numeric | 1 |
| 42002 | Mature | Numeric | 1 |
| Cash Cow | All Cycles | Consolidated | 1 |
| 23001 | Cash Cow | Numeric | 1 |
| 21001 | Cash Cow | Numeric | 1 |
| 32001 | Cash Cow | Numeric | 1 |
| 22001 | Cash Cow | Numeric | 1 |
| 31001 | Cash Cow | Numeric | 1 |
| 33001 | Cash Cow | Numeric | 1 |
| 33002 | Cash Cow | Numeric | 1 |
| 41010 | Cash Cow | Numeric | 1 |
| 41012 | Cash Cow | Numeric | 1 |
| 42001 | Cash Cow | Numeric | 1 |
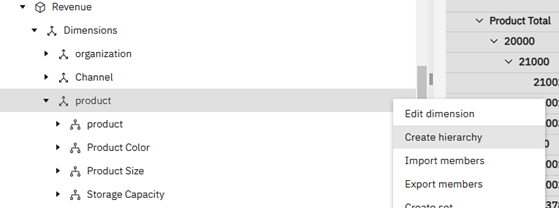
To create this new hierarchy in the Product dimension, right-click on the dimension and select the ‘Create hierarchy’ option.
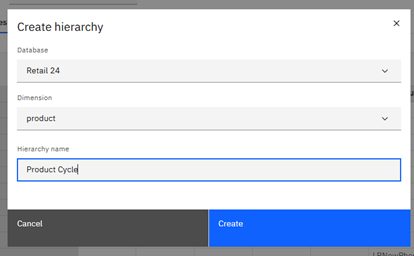
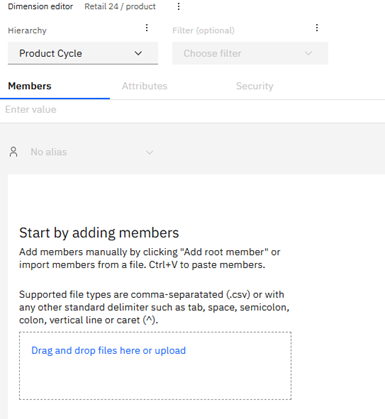
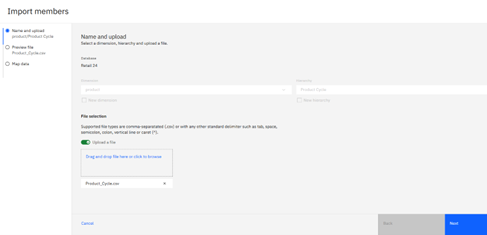
Drag the csv file created previously (Product_Cycle.csv) into the file drop zone and click next.
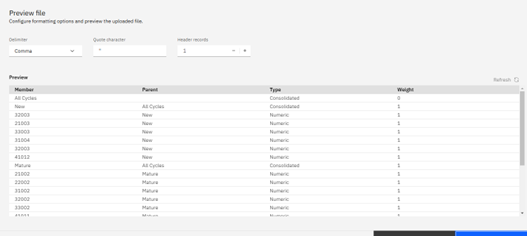
Then, preview the file and, if it’s OK, click next
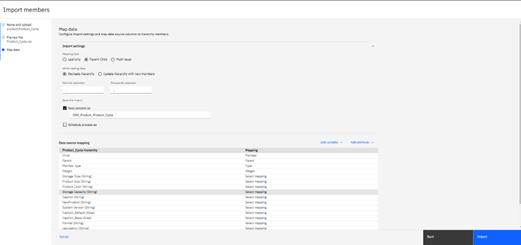
The file has been created in a Parent-Child format and the Loading Data option is set to Recreate hierarchy. Create a name for the process (to be used again) and then map the file to the new hierarchy. Click the Import button.
The data is imported and the new product hierarchy is created.
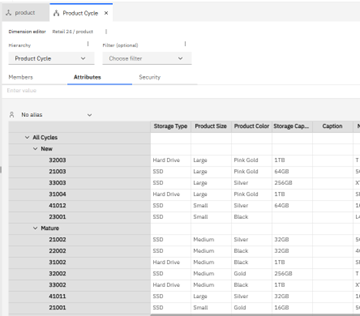
Our spreadsheet has been transformed into a new hierarchy on the Product dimension.
This provides a new level of analysis. The simple Revenue Analysis view shows the Gross Revenue by product type for each month.
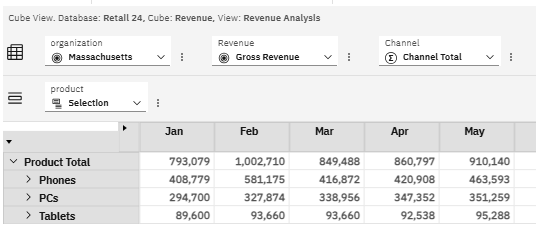
This enables comparisons by sales by position in the product cycle by changing the hierarchy to the Product Cycle
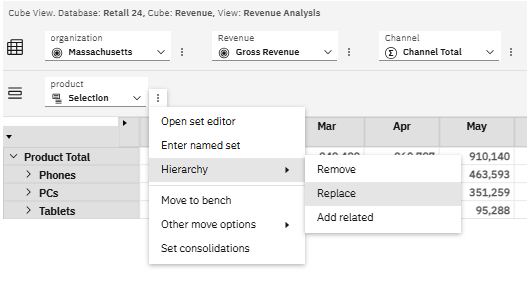
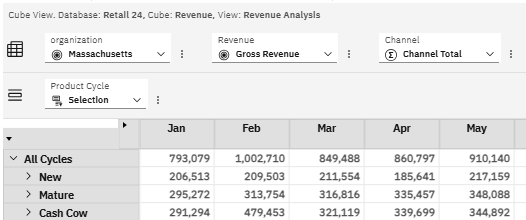
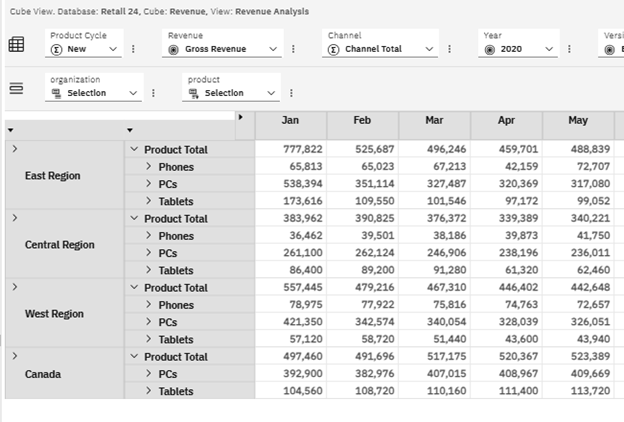
We can increase the level of interrogation by looking for the sales of new products across the regions by product type. We add the hierarchy for Product Cycle and move it up to the context bar, selecting ‘New’. This is using the Product dimension twice!
You can find out more about Planning Analytics by visiting the other articles in our knowledge centre, or by reviewing the IBM documentation.


